Showing posts with label Auckland Council. Show all posts

Monday, November 26, 2018

Amalgamation and Streamlining City Governance: the Auckland Experiment So Far

The performance of the Super City – so far, so so
Previous posts indicate that amalgamating local government in Auckland has not yielded efficiencies. Catch-up spending may account for some of the costs, which have run well ahead of population growth, and the consolidated Council may be doing more things than its predecessors.
However, a failure to deliver on expectations suggests that performance is still a problem. This blog looks at the governance structures underpinning Auckland Council’s decision-making, concluding that amalgamation has simply changed governance problems, not resolved them.

Governance: councillors acting with authority
Authority for governing locally comes from the democratic process. Elected politicians are expected to represent the preferences of constituents in decision-making (which does not reduce the imperative to act within the law, consider sound technical advice, and evaluate the costs, benefits, and risks of alternative courses of action).
Implementing decisions falls to a chief executive appointed by and accountable to the Council. The CEO in turn appoints subordinate managers to implement policies. While the executive team is also required to advise on the decisions the Council takes, staff are not the Council. The Council is an elected body that ultimately speaks and acts collectively.[1]
Boards and managers
Council and staff roles have a parallel in corporate boards of directors and company executives.  Despite different conventions, similar principles apply. For example:
·        Effective engagement is required between council and constituents so that decisions take account of residents’ and ratepayers’ interests;

·        Accountability comes from clarity and openness so that the grounds, costs, and expected outcomes of decisions can be understood by constituents;

·        Clarity of communication and accountability between Mayor and CEO is critical to turning policy decisions into executive actions.
How many around the table?
The effectiveness of governing bodies in the private, not-for-profit, and public organisations is influenced by the size of the governance group. While this is a matter of ongoing professional and academic debate and  deliberation, it is generally agreed that 10 members should be sufficient to bring the necessary breadth of views and skills to the table while avoiding the distractions associated with larger boards.  Councils may have more than ten members, however, or use outside advisors to ensure that the full range of community views are brought to individual issues.[2]
Managing complexity: committees and council-controlled organisations
Councils work in diverse task environments. Traditionally complexity is managed through specialised committees reporting to the full council, which makes decisions based on their recommendations.
Using Council Controlled Organisations to deliver selected public goods and services is another way to deal with complexity. CCOs are governed by appointees, often with business experience, rather than elected representatives.  While operating to a charter framed by the council, they can act outside the confines of the public service.
Auckland’s CCOs – a mixed blessing?
An earlier post suggested that higher costs may be associated with Auckland Council’s reliance on CCOs. Table 1 lists them, including statements of purpose (from annual reports). These indicate changing roles, raising questions around mission creep and how and why council-mandated charters may be altered. 
For example, ATEED positions itself as multi-functional, moving closer to the Council’s environmental management and infrastructure responsibilities, while committing to a whole-of-labour market quality focus.
The Auckland Transport statement suggests a shift from supporting changing land use through transport investment and public transport operations to urban planning (“shaping Auckland”) and shaping transport behaviour.

Table 1: Auckland City’s Council Controlled Organisations
Tails wagging the dog?
It may be inevitable that CCO roles evolve as demographic and economic conditions change. It is also important that those changes reflect rather than lead council policy. (However, CCO directors and officers do have a role to play in advising the Council in their respective areas of expertise.)


Auckland City is now running into hard questions over the CCO model. In the spotlight at the moment, for example,  is the Regional Facilities Agency and the initiatives it is pursuing to “rationalise” long-established sporting venues
Another example is the failure of Panuku Development to align development planning with council plans.  It’s also problematic when a subsidiary pursues commercial objectives contrary to the wishes of the community, as when Ports of Auckland published expansion plans into the Waitemata Harbour. Similarly,  the subsidiary’s “out-of-scope” commercially-founded plans for a hotel and car park clash with Council’s plans for the waterfront.
Issues of autonomy, accountability, and conflict can reduce the value of CCOs and subsidiaries as they are directed by boards a step removed from democratic responsibilities and managed by executives not directly accountable to the Auckland Council CEO.
Local boards: compensating for a reduction in representation?
Local democracy depends on local representation. Amalgamation was in large part about reducing the number of councillors, from around 117 across eight councils in 2009 to 21 today (Table 2). This saw one council member for every 14,500 people in 2009 fall to one for every 64,600 in 2018, a 78% reduction in representation.
There was a slight increase in local board members (25% up compared with community boards in 2009), but given boards' limited responsiblities, the overall reduction in representation and consolidation of regional rather than local governance suggests a significant decline in democratic accountability. The increase in appointed directors of regional-scale CCOs[3] can be seen as contributing further to  the centralisation of decision-making.
Table 2: Local Government Representation, Auckland 209 and 2018

Insofar as participation in elections reflects it, consolidating Auckland did little for elector engagement. Residential turnout for council elections in 2016 was 38%, exactly the same as in 2007.

Local Boards, Local Representation?
It is unlikely that the powers delegated to local boards are sufficient to offset the loss of representation. Although the numbers of elected members of the individual boards lie within a reasonable range for organisational effectiveness (Figure 2, below), the spread of representation (defined as residents per councillor) varies substantially among them, well above the +/- 10% considered appropriate for electoral equity. 
Putting aside the exceptions of Waiheke and Great Barrier islands with their small populations, the highest level of representation is 7,400 persons per board member, well ahead of the lowest at 17,000 (the average being 10,800).
Figure 1: Representation on Local Boards 
And the Council?
Given its size, Auckland Council has the potential to be compromised by unwieldy numbers and the cross-currents and mixed agendas that attend a crowded governance table. The committee structure is unlikely to offset this because, in a rather strange arangement, all councillors are members of the three main committees (Table 3).  Over-sizing committees reduces the advantages of having small groups specialise in key areas before deliberation on policy options by the full Council.
Table 3: Auckland Council Committees
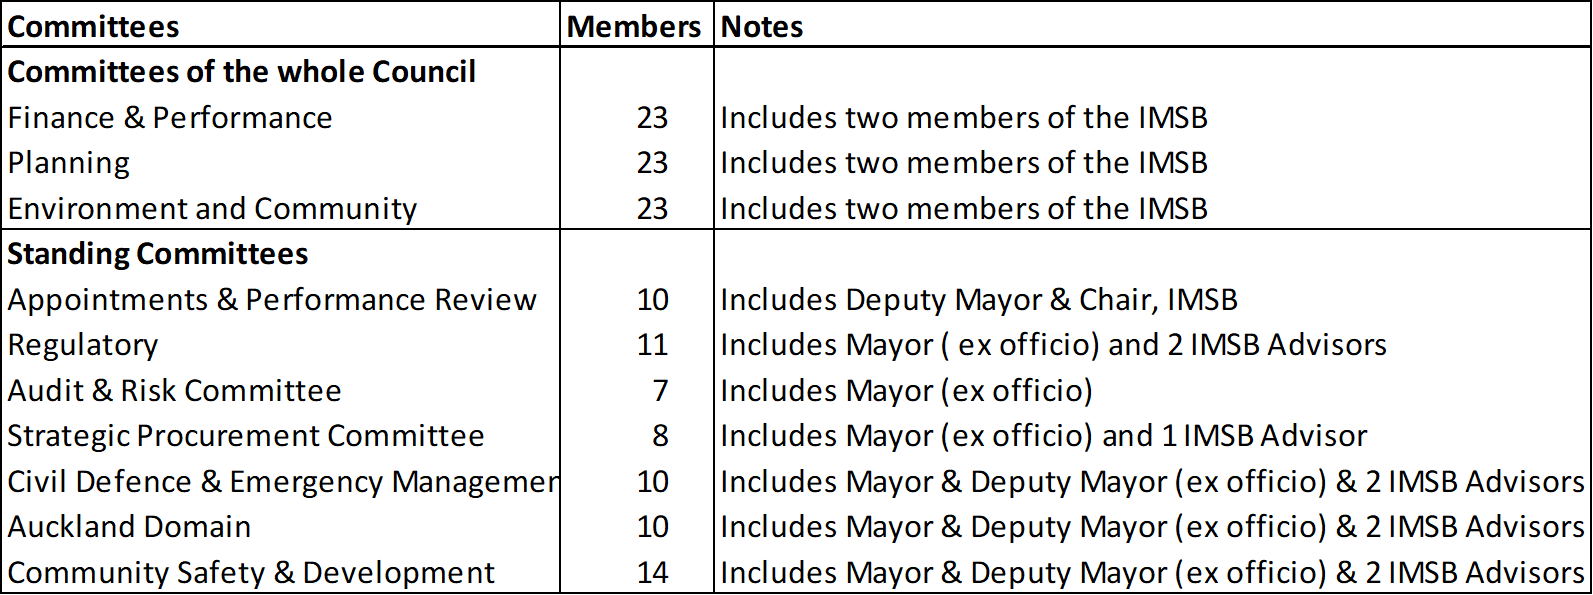
     IMSB: Independent Māori Statutory Committee

Time to review Auckland’s governance arrangements?
The outline of governance here suggests that the Auckland Council has the potential for cumbersome decision-making despite any streamlining intended from consolidation of powers.
For example:
·        The Council operates in a top-heavy manner, if only because its key decision-making functions are subject to deliberation by committees of 22;
·        The relationships among the governors (councillors, CCO directors and board members) and managers are potentially complex and communications constrained across boundaries;
·        Representation within the council is based on low elector turnout, while representation across local boards is uneven.
Given the evidence of rapidly rising costs in Auckland Council’s first eight years, the picture of consolidated power at the centre without obvious democracy, decision-making, or performance benefits suggests that it is time to again review Auckland’s governance arrangements.


[1]            Note to reporters: it is important for clarity to use a singular verb when reporting on the Council. The Council are not to blame for getting it right or wrong: the Council is.
[2]           The Independent Māori  Statutory Board pays an important role in this respect in Auckland.
[3]            The Royal Commission on Auckland Governance (2009) claimed “over 40” CCOs associated with local councils in 2009 (Final report, p.13). This implies a trade-off through amalgamation between many small organisations operating locally and a few large ones operating regionally.

Monday, November 19, 2018

Consolidating a Council - Does Bigger Simply Mean ... Bigger?

Reviewing the Auckland experiment
This is the fourth post reviewing the progress of Auckland Council following the amalgamation in 2010 of seven territorial and one regional authority and the reorganisation of transport and water delivery agencies. The aims included greater regulatory consistency across the region, the capacity to make adequate, coordinated provision for growth, and cost savings.  

The story so far
The previous posts looked at trends in Auckland Council from 2012 to 2018: employment up 17%; employment costs up 24% (in real terms); operating expenditure up 26%; total revenue up 51%. The leap in revenue reflects spending on property, plant and equipment, up 32% in 2018 compared with 2012, or NZ$11bn over the period. All this, while population grew by around 15%. 

Despite the jump in costs and funding, we can’t label the Auckland Experiment a failure on the evidence so far.  So this post adds to the analysis by looking briefly at performance, albeit in general terms. It looks at broad efficiency trends by comparing Auckland with New Zealand’s other regions. These include unitary councils (regional and local functions combined) and multi-council regions.
But first a couple of scene-setters.  What is the role of councils? And how might efficiencies arise from amalgamation and operating at a larger scale? 
Skip these two boxes if you just want to look at the numbers.
Scene Setter 1 - What councils do (or should do)
There are good arguments for local councils to oversee the provision of local public goods where the market won’t deliver or where there are natural monopolies. It is also appropriate for them to levy rates over property to do so, and to charge directly for the services they provide.
Obviously council roles will change as shifts in technology or behaviour create competition where none existed before (and they consequently pull out of infrastructure or service delivery) or where the public appetite for amenities changes (for example from passive to active reserves).
It is important, though, that property rates relate to the infrastructure provided, and that charges for services relate to the fair cost of their production.  It is also important that councils produce infrastructure and services efficiently. Unduly high costs penalise residents and businesses, reducing a city’s competitiveness and attraction. 
Councils also have an obligation to continuously review and evaluate what infrastructure and amenities should be provided, where, and when. In this they are required to reflect on constituents’ needs and preferences, engaging with the community through survey, consultation, submissions, and, ultimately, the ballot box. This is necessary to legitimise new activities and allow cross-subsidies between services, areas, or generations. 
Discretionary council decisions should also: be legal, reasonable (both matters that may be contested in the courts), and should not unduly lower efficiency.

  
Scene Setter 2        Potential efficiencies from reorganisation
There are the three ways by which efficiency might be improved through local government consolidation and reform:
Administrative gains: from lowering administrative, compliance, transaction, and regulatory costs.  Processes may be streamlined, duplication eliminated, best practices implemented, and economies of scale gained (increasing what is achieved by more than what it costs).
Technical gains through improved financial capacity to invest in new systems, processes, and plant to lift output, enhance outcomes, reduce service failures, and lower costs.
Allocative gains from delivering the most appropriate mix of goods and services, and making effective use of capital to best deploy people and plant to achieve desired outcomes.  

Measuring gains
In this post, I consider the efficiencies in Auckland Council that should come from administrative and technical advances using changes in two measures: the number of local government employees and operating expenditure per head of population.


Auckland Council numbers are compared with numbers for all New Zealand regions from 2000 to 2018. Following the logic justifying amalgamation, the creation of Auckland’s large unitary council in 2010 should have increased the residents served relative to council employment numbers and lowered costs to residents more than in regions with smaller, multiple councils.  And within Auckland we would expect council costs to decline relative to population.
The indicators used assume that the council output is a function of population. This is a high order assumption, over-riding differences in the mix and quality of amenities and services and differences in the physical environment of regions.  Equally, employee numbers is also only an approximate measure of inputs.
While these assumptions keep analysis simple, they also limit the conclusions that can be drawn.
Employment up, productivity down?
We know employment growth has been modest within the enlarged Auckland Council, confined to Council Controlled Organisations. However, the costs of council employment have risen significantly, in part through staff movement into higher-paid bands. 
To consider the bigger picture, the number of residents in each of the 16 regions was divided by the number of people employed in local government administration and in water supply, sewage and drainage servcies (sourced from Business Demography, Statistics NZ). The higher the figure, the more productive a region is (fewer employees relative to residents).  The line should rise if productivity is improving.

The results for Auckland and the median for all regions have been plotted in Figure 1. Auckland stands out as more productive than most regions, but contrary to expectations, more so before the 2010 reforms than after.  Other strong performers are smaller regions with unitary councils (Gisborne, Nelson, and especially Tasman).
Figure 1: Residents per Council Employee, 2000-2018 
The downward slope indicates more employees relative to population, suggesting falling productivity. Of course, this may indicate changes in the scope of council activities, but it is hard to envisage a shift that would lead to a 26% fall in 8 years (as in Auckland) or even a 14% fall (as in the national median). And if costs rise faster than output, regional (and national) productivity suffers.

While Auckland ranks well against other regions on this measure (see the bar graph and right-hand scale), its steep downward slope and convergence on the median across regions is inconsistent with expectations of economic gains from consolidation (despite the recovery in 2017).

Expenditure: more for less?
Operating expenses (sourced from Statistics NZ) have been summed for councils in each region from 2000 to 2017, converted to 2018 dollars and divided through by regional populations.  In theory, expenditure per head should fall as councils become more efficient, and should be lower in larger councils, Auckland being the obvious example (see the Scene Setter 2, above).


Well, neither expectation appears to hold. Operating costs per employee have been increasing.  In Auckland there was some moderation after 2012 but it is difficult to distinguish its performance from the median for all councils in Figure 2. 

Figure 2 also includes high and low performers.  The best performing regions fall below the lower quartile and the worst above the higher quartile.  The single best performer recently has been the Hawke's Bay with its population concentrated in the twin cities of Napier and Hastings. The worst has been the West Coast with its sparse population spread over a physically challenging area. 
The key observation, though, is that efficiency as measured here has not improved in Auckland which continues to sit around the middle of the pack. 

Figure 2: Council Expenditure per Resident, 2000-2017
What can we conclude?

On the measures used here, local government costs are moving ahead of population growth in most regions. Auckland is no exception. At best, te city has maintained efficiency in line with other regions. Consolidation of Auckland's councils has not been enough to reverse a decline. 


As noted, these measures of efficiency assume a similar mix and level of services delivered by the consolidated council as delivered under similar conditions by councils in other regions, and as delivered by the previous Auckland councils. At the level this analysis, our most robust conclusion is that the measures used provide no evidence that consolidation has lifted Auckland's game. To date, the costs of consolidation have not yielded obvous benefits.
Exploring why means looking into allocative efficiency: is the additional funding Auckland Council is receiving being allocated to investments that lift productivity as they deliver better services? In the absence of evidence of better performance the consolidated council does not hyet yet appear to be on the path to savings. And if Auckland is going to deliver on the promise of 2010, can we afford the spending evidently required to get there?  

→ An aside on allocative efficiency
Sound allocation decisions are  necessary to deliver operating gains: spending the right amount on the right things and getting the right people to put them in place. In Auckland Council resource allocation is driven in large part by Council Controlled Organisations. The quality of resource allocation decisions needs unravelling at that level. 


However, it is timely to note that a recent internal report regarding decision-making for cycleway investment by Auckland Transport identifies that spending was justified by over-estimating demand.  This is on top of major under-estimates of the cost of the Central Rail Link which was justified on the basis of a $2.3bn budget in 2011 (and a series of assumptions that were hardly grounded in reality). That budget  had (predictably) blown out to $3.4bn by  2016, and continues to climb, with no clarity on where it will end up. 
These examples confirm how large organisations are prone to resource misallocation; the larger the project the more likely it is to blow out, and the bigger any over-run will be. The impact of failures in resource allocation decisions in a large council can be further-reaching than similar failures by smaller organisations, given the increased funds at their disposal. And placing a substantial share of the increased funds in CCOs at arm's length from the political process may be no remedy.  Poor spending decisions by councillors or their agents and advisors can lead to uneconomic investment: over- or under-capacity, in the wrong place, badly timed, or over-priced.  The end result? A drag on city efficiency and productivity.

 [1] There is a difference.  Efficiency refers to how well tasks are done, and specified outcomes       achieved.  Productivity requires that those outcomes are the correct ones.


Wednesday, October 24, 2018

Auckland’s Super City and the Costs of Consolidation

Synopsis
This post sets out trends in the costs incurred by the Auckland Council over the past six years.  The Government created a single council plus subsidiaries model for the governance of the region in 2010.

The post starts with an update of the cost of employment growth in the new Council.  It then shows that under the new structure the rate of investment has been an even bigger driver of cost increases. Costs have clearly outstripped population growth, suggesting that the model adopted has not prevented the so-called super city from running into the diseconomies associated with excessive scale.

Early hopes – and risks
Problems reconciling regional infrastructure and environmental policy with local interests led to consolidation of one regional and seven territorial councils into a single “super city”.  Auckland Council was created in 2010 as a city of 1.44m people.  It was intended to reconcile competing territorial interests, rationalise public investment, align regulation and services, streamline processes, and achieve economies of scale. All this, it was believed , would make Auckland competitive on a world stage and lead to a “more liveable” city.
I questioned whether the reorganisation would achieve efficiencies, or simply lead to diminishing returns from increased organisational size and complexity. With eight years of the super Council behind us, we can consider how well it has worked. In this post, I consider cost performance.

But first, does bigger mean better?
(Skip this section if you just want to see the numbers).
Auckland’s consolidation was based on the premise that a bigger organisation would be better for a growing city.  But there are flaws in that assumption. 

As organisations grow beyond an optimum size, returns to scale fall and even reverse as efficiencies become outweighed by the shortcomings – the diseconomies -- of oversizing. Large producers and service providers may be impeded by ageing technology and legacy products and services, becoming vulnerable to competition from new entrants and innovators. Top-heavy management, entrenched processes and behaviours, structural and social complexity slow organisations’ responses to changing circumstances. Investment and operating practices become erratic as internal units pursue their interests without regard to the goals of the wider organisation or as they compete for internal resources.
We have seen organisational failures from excessive scale in manufacturing, aviation, construction, retailing, computing, IT, financial services, and others. Some large organisations may avoid collapse by transforming themselves into smaller units, a painful and not always successful process.  Others may be taken over, absorbed, or simply closed.  A few get bailed out. 

Large cities can also fail, when advantages of agglomeration are offset by increasing costs.  Businesses may suffer from the constraints of ageing and under-capacity infrastructure, increasing service charges, and rising land costs. Congestion and high house prices impact on employment costs and reduce a city’s attraction to new and existing households, leading to skill shortages.
Diminishing returns also apply to city councils.  And when large councils fall short, ratepayers pay. This may well be the case for Auckland if the Council’s costs run too far ahead of population growth.

The data
The figures used to explore Auckland Council’s costs are from annual reports.  Group costs are divided between the “core Council” and its subsidiaries[1]. The analysis is indicative, based on aggregate cost movements. All amounts are adjusted to 2018 dollars using the CPI.
An update on employment – onward and upward
My last post documented Council employment growth, especially in higher income brackets, from 2012 to 2017.[2]  The Annual Report to June 2018 is now available.  Here’s what happened:

Group employment growth slowed to 0.8% in 2018, compared with 3.4% average over the previous five years. The gain from 2012 to 2018 stills sits at 18%, though, (1,830 more employees), ahead of 15% population growth in the city.
Core Council employment[3] fell by 1% in 2018. 200 jobs were lost from the under $100,000 salary bracket.  Against this, the numbers in the $100,000 to $200,000 band were up 11.5% (140 jobs).

Here’s the rub: in 2018 employment in council subsidiaries and CCOs grew by 3.2% (150 jobs), with over half of this in positions paying more than $100,000 a year. Over the six years to 2018 employment in subsidiaries increased by 1,460 people (43%) with 35% among those earning over $100,000. In 2018 there were over 1,000 people earning between $100,000 and $200,000 in the subsidiaries, and 120 earning over $200,000.
Although employment growth slowed in 2018, higher paid jobs continued to grow. The result?  A 24% increase in the cost of employment ($168m) between 2012 and 2018.

It appears that council-controlled organisations are a Trojan horse –a vehicle for employment and salary growth a step removed from political control (Figure 1).  In 2013 they accounted for 33% of the Group workforce.  Today, they account for 40%, and for 47% of employees earning between $100,000 and $200,000, and for 82% of those earning over $200,000.  Subsidiaries and CCOs jointly accounted for 74% of the growth in Group employment costs.

Figure 1: Wage, Salary & Superannuation Costs, 2012 - 2018
This cementing in of high-end salaries reinforces my view that super City performance is likely to be impeded by the growth of a tier of management committed to keeping the organisation going as much as to achieving its community objectives. 

More people and higher salaries cement in higher costs.  But just how much do they contribute to an overall increase in council costs?  This rest of this post looks at what is happening to other council costs.
Costs: the bigger picture
Group operating expenditure grew 26% in real term from 2012 to 2018 (over $800m), ahead of the 24% increase in employment costs.  The biggest boost came from depreciation and amortisation[4], up almost $200m (30%). Nearly 70% of this was attributable to subsidiaries and CCOs (Figure 2). 

Figure 2: Expenditure by Category, Core Council and Subsidiaries, 2012-2017
The growth of depreciation reflects an increase of over $11bn in the Council’s property, plant and equipment portfolio (up 32%) from 2012 to 2018. A rapid increase in tangible assets is also reflected in repairs and maintenance spending (20% of the “Other” category in Figure 2), with annual costs up by 46%  ($84m) from 2012 to 2018 (Figure 3). 
Figure 3: Tangible Asset Values and Costs
A high level of investment commits the Council to substantial long-term costs. This is also the case with respect to property expenses, apparently responding to increased employment or newer, better-appointed offices to reflect the increasing salaries being paid: utilities, occupancy, rental and lease costs climbed by 79% ($69m).
In contrast, the largest category of Other spending, on goods and services, grew by just
10% (still up by $68m over six years, to $723m in 2018).  Only consultancy and professional services declined, by one third to $140m.[5]

Subsidiaries and CCOs grew more rapidly than the core Council in all categories other than finance costs. This presumably reflects the role of the core in funding increased civic investment and activity through its CCOs. 
Internal Transfers
This funding role is also evident in core Council spending on grants, subsidies, and sponsorships (GSS).  While the detail of transfers is not provided in the City’s annual reports, a large share are made to CCO investment and operations. Core Council expenditure on GSS grew by 65% from $623m in 2012 to $1,030 in 2018, 54% of the total increase in core Council costs over the period. 

The 2018 annual report identifies that around 88% of these payments went to the CCOs in 2017 and 2018, with Auckland Transport the principle recipient.

Conclusions and questions
Two obvious conclusions can be taken from this brief analysis:
·        Council costs are ramping up ahead of population growth, primarily through commitment to a substantial investment programme over the past six years, backed by an increasingly expensive if not expansive workforce.

·        Reliance on a CCO model in the consolidated council has been central to the increase in employment, investment, and related costs. In 2018 CCOs and subsidiaries account for 70% of council investment in property, plant and equipment ($32.7bn).  
In light of these conclusions, it is interesting that the Royal Commission on Auckland Governance put budgeted operating costs across eight councils in 2008-09 at close to $2b and capital investment at $1.25bn.[6] In 2018 dollars this is around $2,600/head of population. It compares with $4,580/head in 2018, a 76% increase in just ten years! 

Given these observations, determining the efficiency and effectiveness of the Council's increased spending clearly requires analysis of the individual CCO accounts. A number of questions need addressing, among them:
·        Does the spectacular growth in council costs result from a prior failure to meet the city’s needs? Does it reflect a fundamental change in the direction and scope of council activity? Or has the organisation simply over-stepped the threshold of efficiency? 

·        Do the CCOs enhance the effectiveness of the Council, and local democracy? Or are they reducing the accountability of the Council at the same time as it increases the scope, scale, and quality of its investment?

·        Is a governance model that focuses on functional specialisation at a regional level rather than on local priorities, appropriate for a diverse and growing city?

And, of course, who pays, and how?  This is the subject of my next blog.  


[1]           Subsidiaries include five Council Controlled Organisations (CCOs), Ports of Auckland Ltd, and Auckland Council Investments Ltd.
[2]           2012 rather than 2010 is used as the base year to provide for the costs of reorganisation before then, and because of more consistent and therefore comparable reporting.
[3]           The core Council conducts those functions not delegated to Council Controlled Organisations or performed by subsidiaries
[4]           Depreciation is applied to tangible assets, amortisation to intangible assets
[5]           It might be argued that the reduction of $67m in fees goes some way – but only some way - towards offsetting the $157m boost in wage and salary costs
[6]           Royal Commission on Auckland Governance (2009) Volume 1, Executive Summary p15, Department of Internal Affairs

Thursday, September 6, 2018

But Wait! there’s more. Why a bed tax on Airbnb in Auckland really is a bad tax


The opposition is growing
A couple of blogs back I said that imposing a bed tax on informal accommodation mostly offered through peer-to-peer web sites is a bad idea.  My reasons: it is a targeted tax, it ignores the fact that the accommodation capacity made available through platforms like Airbnb is already paid for by rates and user charges; and visitors who pay to use spare rooms or backyard cottages can be expected to have no more impact on public services than family members or friends who don’t pay. 

The informal sector provides low cost capacity at the margins to support the expansion of the visitor industry, thereby reducing uncertainty for commercial investors in tourism.  The Auckland Chamber of Commerce made the additional point that Airbnb, Book-a-Bach, and the like cater for visitors who might not otherwise visit Auckland.  So I struggle to understand why the Council should take this stand, especially when the idea of a bed tax on commercial accommodation is already under attack. 
The more I read about the policy the less I like it. Here are four reasons.

1             A Poorly Designed Tax
The tax is complicated, intrusive, and consequently inefficient. It is being added to the rates bill, confounding what is otherwise a generally straightforward levy based on the capital value of property.  This confusing revenue collection process by local government will impose new administrative costs for little gain.  
The Council evidently identified between 8,000 and 12,000 households renting out rooms or properties, and has managed to target 1,100 of them.  It sent out two letters to those it identified and set the rate depending on whether the owners replied or not[1].  Too bad if you were away at the time, or failed to clear your mail, or simply thought it was all a bit silly, and didn’t reply. The result: a higher rate set as punishment. 

Oh, if you only rent out one room or let rooms for fewer than 29 nights in a year you won’t have to pay. Good luck to the Council in enforcing that. I wonder if the cost in wages (and political capital) is worth the effort.

2              Compounding the tax impost
The new rate is actually a tax, a tax on providers rather than on consumers.  Bed-taxes  are an expensive form of revenue collection compared, with say, a visitor levy collected at port or airport. And the amount they might generate is trivial in the bigger picture: GST, rates on commercial tourism properties, and income tax derived from the hospitality sector already contribute substantially to government revenue. [2]
In the case of the informal accommodation sector, the revenue received by owners who use booking platforms to attract short-stay visitors to their spare room, empty cottage, or holdiay home is already captured in the income tax net. They also pay additional user charges for the services consumed through their property.

The bed tax is inequitable in a number of ways.  Owners are treated differently from those who let rooms or cottages to long-stay tenants or outside formal booking platforms, or anyone else running a small business from a residential area. The use of spare capacity in the housing sector, a sector in which many households are over-invested, is penalised when many would think it should be encouraged. 

Inequity is compounded when the providers of bed and breakfast services are working to make ends meet with a little additional income.  There are many households in Auckland having to do this with long-term sub-lets.  Why should those that take the short-term rental path instead be treated differently?

3              A new ratepayer business subsidy
According to the Mayor, the revenue raised by bed taxes generally (including from AirBnB operators) is used to fund Auckland Tourism, Events, and Economic Development (ATEED), Auckland Council’s development agency.  

ATEED incurs spends on marketing and promotions to boost demand for selected commercial goods, services (including underwriting events), and sectors.  This may be justifiable for emerging sectors, to support innovation, and even for city branding. 
But these are items that might be more appropriately charged to general revenues of the Council in a clearly transparent, politically contestable process.  Beyond that, initiatives to promote established sectors like tourism may be best funded by direct charges on the beneficiaries.  The capacity to fund would then be based on capacity to deliver, rather than on coercion; on revenue earned rather than on tax- based subsidies. 

4              An Anti-Competitive Move
Finally, the new bed tax appears to be an anti-competitive move by the council. The Mayor saysit was introduced after representatives from the hotel and motel industry approached him about Airbnb’s advantages”.  Hmmm – are these the same interests benefiting from the subsidies ATEED passes on?  It begins to look like they want it both ways. 
Either way, I question the role of local government in manipulating rates to manipulate the market.
Informal accommodation has always been around.  It is better organised today, and demand has grown as a result of innovative, web-based booking systems – which, incidentally are increasingly relied on by hotel and motel operators.  The new platforms are also raising standards through user and provider feedback.

It is a pity to levy rates to counter any perceived competitive impact , consequently suppressing some of the innovation and enterprise that a mature sector needs to stay healthy. 

So why bother?
Tourism has boomed in New Zealand and around the world.  The question is how much we want to participate in that boom.  Here’s what Statistics NZ estimates tourism was worth to New Zealand in the year ending March 2017:[3]

·         Total expenditure $36.0 billion;
·         International tourism expenditure $14.5 billion;
·         Domestic tourism expenditure $21.4 billion;
·         Direct contribution to GDP: $14.7 billion (5.9% of NZ GDP);
·         Indirect value added of industries supporting tourism $11.3             billion (4.6% of NZ GDP);
·         230,793 people directly employed in tourism (8.4% of NZ                  employment);
·         $3.3 billion in goods and services taxes.

This is a business worth maintaining and hgrowing.  More detailed 2016 figure indicate that spending was close to $1,000 for every international visitor night recorded.  The guests in Airbnb and Book-a-Bach may spend a little less, and many of them will be New Zealanders, but surely we don’t want to exclude participation by home-based providers in a sector that returns so much to the country.

Tourism in Auckland
How about tourists in Auckland?

Here are some figures from the ATEED website.  There was an estimated 7.32m guest nights in commercial accommodation in the year ending June 2018, based on a total of 5.59m domestic overnight visits and 2.69m international arrivals.  Their estimated spend of $8.36bn in the region must have done a fair bit to sustain Auckland businesses and their rates payments, on top of a Goods & Services Tax contribution of over $1bn . 

Conclusion
The Council is wasting resources and political capital on chasing a minor sum that will discourage a valuable activity on the fringes of our visitor sector.

If it really wants to play in the tourist pool, why not lobby government to splash out a share of all the GST that visitors generate in Auckland.  

Or else simply be grateful for the support visitors give to the retail, entertainment, and hospitality sectors, and continue to collect rates from the properties and businesses they support. But think again about implementing a bad tax to fund a promotional agency, ATEED, with revenue of $84.6m in 2017 (up 37% on 2016), 83% of which is in any case funded by grants and subsidies (up 29% on 2016) primarily provided by the ratepayer. 


[1]              Interview with Mayor Phil Goff on the AM Show
[2]              The Council is not sure what the take will be from a commercial bed tax, although it appears that last years collection was just over $13m.
[3]              Satellite Tourism Accounts 2017, Statistics NZ, p7