The performance of the Super City – so far, so so
Previous posts indicate that amalgamating
local government in Auckland has not yielded efficiencies.
Catch-up spending may account for some of the costs, which have run well ahead
of population growth, and the consolidated Council may be doing more things
than its predecessors.
However, a failure to deliver on
expectations suggests that performance is still a problem. This blog looks at
the governance structures underpinning Auckland Council’s decision-making,
concluding that amalgamation has simply changed governance problems, not resolved them.
Governance: councillors acting with authority
Authority for governing locally comes from the democratic process. Elected politicians are expected to
represent the preferences of constituents in decision-making (which does not
reduce the imperative to act within the law, consider sound technical advice,
and evaluate the costs, benefits, and risks of alternative courses of action).
Implementing decisions falls to a
chief executive appointed by and accountable to the Council. The CEO in turn
appoints subordinate managers to implement policies. While the executive team is
also required to advise on the decisions the Council takes, staff are not
the Council. The Council is an elected body that ultimately speaks and acts
collectively.[1]
Boards and managers
Council and staff roles have a parallel
in corporate boards of directors and company executives. Despite different conventions, similar
principles apply. For example:
·
Effective
engagement is required between council and constituents so that decisions take account
of residents’ and ratepayers’ interests;
·
Accountability
comes from clarity and openness so that the grounds, costs, and expected
outcomes of decisions can be understood by constituents;
·
Clarity of
communication and accountability between Mayor and CEO is critical to turning
policy decisions into executive actions.
How many around the table?
The effectiveness of governing
bodies in the private, not-for-profit, and public organisations is influenced
by the size of the governance group. While this is a matter of ongoing professional
and academic debate and deliberation, it is generally agreed that 10 members should be sufficient to
bring the necessary breadth of views and skills to the table while avoiding the distractions
associated with larger boards. Councils
may have more than ten members, however, or use outside advisors to ensure that the full range of
community views are brought to individual issues.[2]
Managing complexity: committees and council-controlled
organisations
Councils work in diverse task
environments. Traditionally complexity is managed through specialised committees
reporting to the full council, which makes decisions based on their recommendations.
Using Council Controlled
Organisations to deliver selected public goods and services is another way to deal
with complexity. CCOs are governed by appointees, often with business
experience, rather than elected representatives. While operating to a charter framed by the council,
they can act outside the confines of the public service.
Auckland’s CCOs – a mixed blessing?
An earlier post suggested that higher
costs may be associated with Auckland Council’s reliance
on CCOs. Table 1 lists them, including statements of purpose (from
annual reports). These indicate changing roles, raising questions around
mission creep and how and why council-mandated charters may be altered.
For example, ATEED positions
itself as multi-functional, moving closer to the Council’s environmental
management and infrastructure responsibilities, while committing to a whole-of-labour
market quality focus.
The Auckland Transport statement suggests
a shift from supporting changing land use through transport investment and
public transport operations to urban planning (“shaping Auckland”) and shaping transport
behaviour.
Table 1: Auckland City’s Council Controlled Organisations 
Tails wagging the dog?
It may be inevitable that CCO roles evolve as demographic and economic conditions change. It is also important that those changes reflect rather than lead council policy. (However, CCO directors and officers do have a role to play in advising the Council in their respective areas of expertise.)
Auckland City is now running into hard
questions over the CCO model. In the spotlight at the moment, for
example, is the Regional Facilities
Agency and the initiatives it is pursuing to “rationalise” long-established sporting
venues.
Another example
is the failure of Panuku Development to align development planning with council
plans. It’s also problematic when a
subsidiary pursues commercial objectives contrary to the wishes of the community,
as when Ports of Auckland published expansion
plans into the Waitemata Harbour. Similarly, the subsidiary’s “out-of-scope” commercially-founded
plans for a hotel and car park clash with Council’s
plans for the waterfront.
Issues of autonomy,
accountability, and conflict can reduce the value of CCOs and subsidiaries as they are directed by boards a step removed from democratic
responsibilities and managed by executives not directly accountable to the
Auckland Council CEO.
Local boards: compensating for a reduction in representation?
Local democracy depends on local representation. Amalgamation was in large part about reducing the number of councillors, from around 117 across eight councils in 2009 to 21 today (Table 2). This saw one council member for every 14,500 people in 2009 fall to one for every 64,600 in 2018, a 78% reduction in representation.
Local democracy depends on local representation. Amalgamation was in large part about reducing the number of councillors, from around 117 across eight councils in 2009 to 21 today (Table 2). This saw one council member for every 14,500 people in 2009 fall to one for every 64,600 in 2018, a 78% reduction in representation.
There was a slight increase in
local board members (25% up compared with community boards in 2009), but given boards' limited responsiblities, the
overall reduction in representation and consolidation of regional rather than
local governance suggests a significant decline in democratic accountability. The
increase in appointed directors of regional-scale CCOs[3]
can be seen as contributing further to the centralisation of decision-making.
Table 2: Local Government Representation, Auckland 209 and 2018

Local Boards, Local Representation?
It is unlikely that the powers delegated to local boards are sufficient to offset the loss of representation. Although the numbers of elected members of the individual boards lie within a reasonable range for organisational effectiveness (Figure 2, below), the spread of representation (defined as residents per councillor) varies substantially among them, well above the +/- 10% considered appropriate for electoral equity.
Putting aside the exceptions of Waiheke
and Great Barrier islands with their small populations, the highest level of
representation is 7,400 persons per board member, well ahead of the lowest at 17,000
(the average being 10,800).
Figure 1: Representation on Local Boards

Given its size, Auckland Council has
the potential to be compromised by unwieldy numbers and the cross-currents and mixed
agendas that attend a crowded governance table. The committee
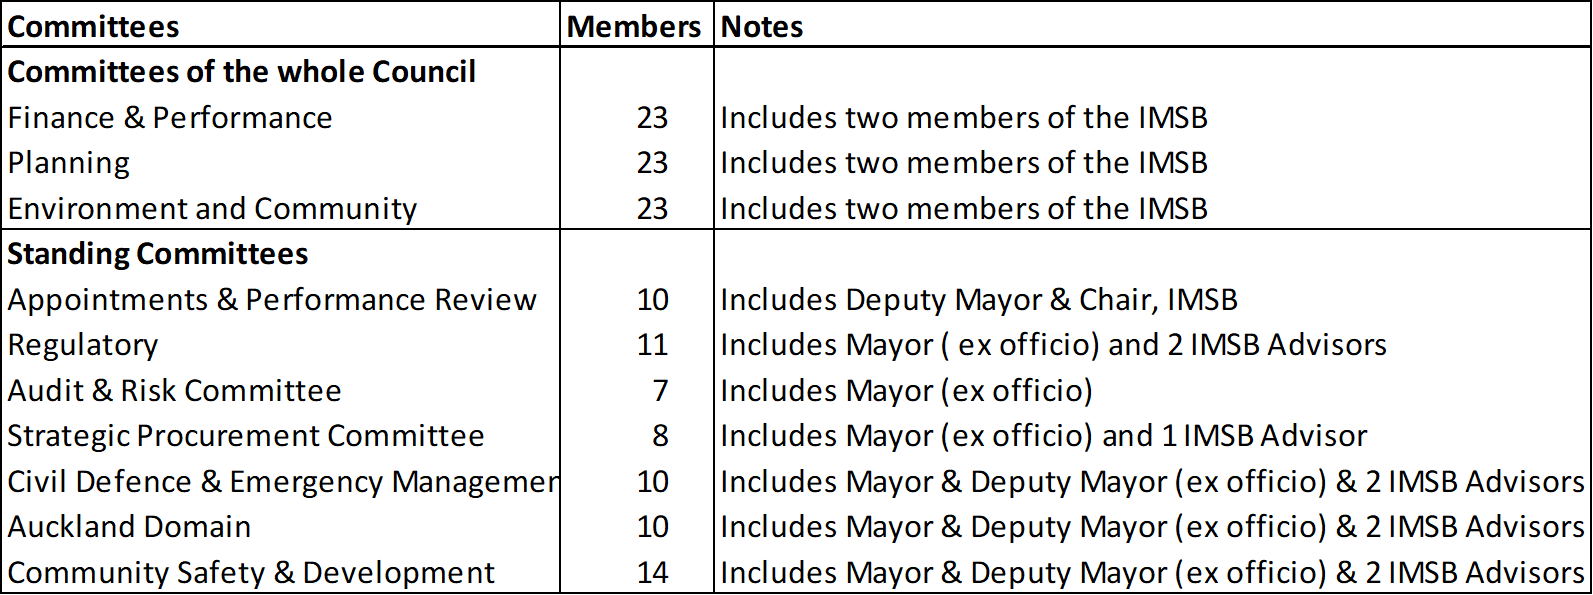
structure is unlikely to offset this because, in a rather strange arangement, all councillors are members of the three main committees
(Table 3). Over-sizing committees reduces
the advantages of having small groups specialise in key areas before deliberation on policy options by the full Council.
Table 3: Auckland Council Committees
Time to review Auckland’s governance arrangements?
The outline of governance here suggests that the Auckland Council has the potential for cumbersome decision-making despite any streamlining intended from consolidation of powers.
The outline of governance here suggests that the Auckland Council has the potential for cumbersome decision-making despite any streamlining intended from consolidation of powers.
For example:
·
The Council operates
in a top-heavy manner, if only because its key decision-making functions are
subject to deliberation by committees of 22;
·
The
relationships among the governors (councillors, CCO directors and board members) and managers are potentially complex
and communications constrained across boundaries;
·
Representation
within the council is based on low elector turnout, while representation across
local boards is uneven.
Given the evidence of rapidly
rising costs in Auckland Council’s first eight years, the picture of consolidated power at the centre without obvious democracy,
decision-making, or performance benefits suggests that it is time to again review
Auckland’s governance arrangements.
[1] Note to reporters: it is important
for clarity to use a singular verb when reporting on the Council. The Council are
not to blame for getting it right or wrong: the Council is.
[2] The Independent Māori Statutory Board pays an important role in this
respect in Auckland.
[3] The Royal Commission on Auckland
Governance (2009) claimed “over 40” CCOs associated with local councils in 2009
(Final report, p.13). This implies a trade-off through amalgamation between many small organisations
operating locally and a few large ones operating regionally.


