Monday, November 26, 2018

Amalgamation and Streamlining City Governance: the Auckland Experiment So Far

The performance of the Super City – so far, so so
Previous posts indicate that amalgamating local government in Auckland has not yielded efficiencies. Catch-up spending may account for some of the costs, which have run well ahead of population growth, and the consolidated Council may be doing more things than its predecessors.
However, a failure to deliver on expectations suggests that performance is still a problem. This blog looks at the governance structures underpinning Auckland Council’s decision-making, concluding that amalgamation has simply changed governance problems, not resolved them.

Governance: councillors acting with authority
Authority for governing locally comes from the democratic process. Elected politicians are expected to represent the preferences of constituents in decision-making (which does not reduce the imperative to act within the law, consider sound technical advice, and evaluate the costs, benefits, and risks of alternative courses of action).
Implementing decisions falls to a chief executive appointed by and accountable to the Council. The CEO in turn appoints subordinate managers to implement policies. While the executive team is also required to advise on the decisions the Council takes, staff are not the Council. The Council is an elected body that ultimately speaks and acts collectively.[1]
Boards and managers
Council and staff roles have a parallel in corporate boards of directors and company executives.  Despite different conventions, similar principles apply. For example:
·        Effective engagement is required between council and constituents so that decisions take account of residents’ and ratepayers’ interests;

·        Accountability comes from clarity and openness so that the grounds, costs, and expected outcomes of decisions can be understood by constituents;

·        Clarity of communication and accountability between Mayor and CEO is critical to turning policy decisions into executive actions.
How many around the table?
The effectiveness of governing bodies in the private, not-for-profit, and public organisations is influenced by the size of the governance group. While this is a matter of ongoing professional and academic debate and  deliberation, it is generally agreed that 10 members should be sufficient to bring the necessary breadth of views and skills to the table while avoiding the distractions associated with larger boards.  Councils may have more than ten members, however, or use outside advisors to ensure that the full range of community views are brought to individual issues.[2]
Managing complexity: committees and council-controlled organisations
Councils work in diverse task environments. Traditionally complexity is managed through specialised committees reporting to the full council, which makes decisions based on their recommendations.
Using Council Controlled Organisations to deliver selected public goods and services is another way to deal with complexity. CCOs are governed by appointees, often with business experience, rather than elected representatives.  While operating to a charter framed by the council, they can act outside the confines of the public service.
Auckland’s CCOs – a mixed blessing?
An earlier post suggested that higher costs may be associated with Auckland Council’s reliance on CCOs. Table 1 lists them, including statements of purpose (from annual reports). These indicate changing roles, raising questions around mission creep and how and why council-mandated charters may be altered. 
For example, ATEED positions itself as multi-functional, moving closer to the Council’s environmental management and infrastructure responsibilities, while committing to a whole-of-labour market quality focus.
The Auckland Transport statement suggests a shift from supporting changing land use through transport investment and public transport operations to urban planning (“shaping Auckland”) and shaping transport behaviour.

Table 1: Auckland City’s Council Controlled Organisations
Tails wagging the dog?
It may be inevitable that CCO roles evolve as demographic and economic conditions change. It is also important that those changes reflect rather than lead council policy. (However, CCO directors and officers do have a role to play in advising the Council in their respective areas of expertise.)


Auckland City is now running into hard questions over the CCO model. In the spotlight at the moment, for example,  is the Regional Facilities Agency and the initiatives it is pursuing to “rationalise” long-established sporting venues
Another example is the failure of Panuku Development to align development planning with council plans.  It’s also problematic when a subsidiary pursues commercial objectives contrary to the wishes of the community, as when Ports of Auckland published expansion plans into the Waitemata Harbour. Similarly,  the subsidiary’s “out-of-scope” commercially-founded plans for a hotel and car park clash with Council’s plans for the waterfront.
Issues of autonomy, accountability, and conflict can reduce the value of CCOs and subsidiaries as they are directed by boards a step removed from democratic responsibilities and managed by executives not directly accountable to the Auckland Council CEO.
Local boards: compensating for a reduction in representation?
Local democracy depends on local representation. Amalgamation was in large part about reducing the number of councillors, from around 117 across eight councils in 2009 to 21 today (Table 2). This saw one council member for every 14,500 people in 2009 fall to one for every 64,600 in 2018, a 78% reduction in representation.
There was a slight increase in local board members (25% up compared with community boards in 2009), but given boards' limited responsiblities, the overall reduction in representation and consolidation of regional rather than local governance suggests a significant decline in democratic accountability. The increase in appointed directors of regional-scale CCOs[3] can be seen as contributing further to  the centralisation of decision-making.
Table 2: Local Government Representation, Auckland 209 and 2018

Insofar as participation in elections reflects it, consolidating Auckland did little for elector engagement. Residential turnout for council elections in 2016 was 38%, exactly the same as in 2007.

Local Boards, Local Representation?
It is unlikely that the powers delegated to local boards are sufficient to offset the loss of representation. Although the numbers of elected members of the individual boards lie within a reasonable range for organisational effectiveness (Figure 2, below), the spread of representation (defined as residents per councillor) varies substantially among them, well above the +/- 10% considered appropriate for electoral equity. 
Putting aside the exceptions of Waiheke and Great Barrier islands with their small populations, the highest level of representation is 7,400 persons per board member, well ahead of the lowest at 17,000 (the average being 10,800).
Figure 1: Representation on Local Boards 
And the Council?
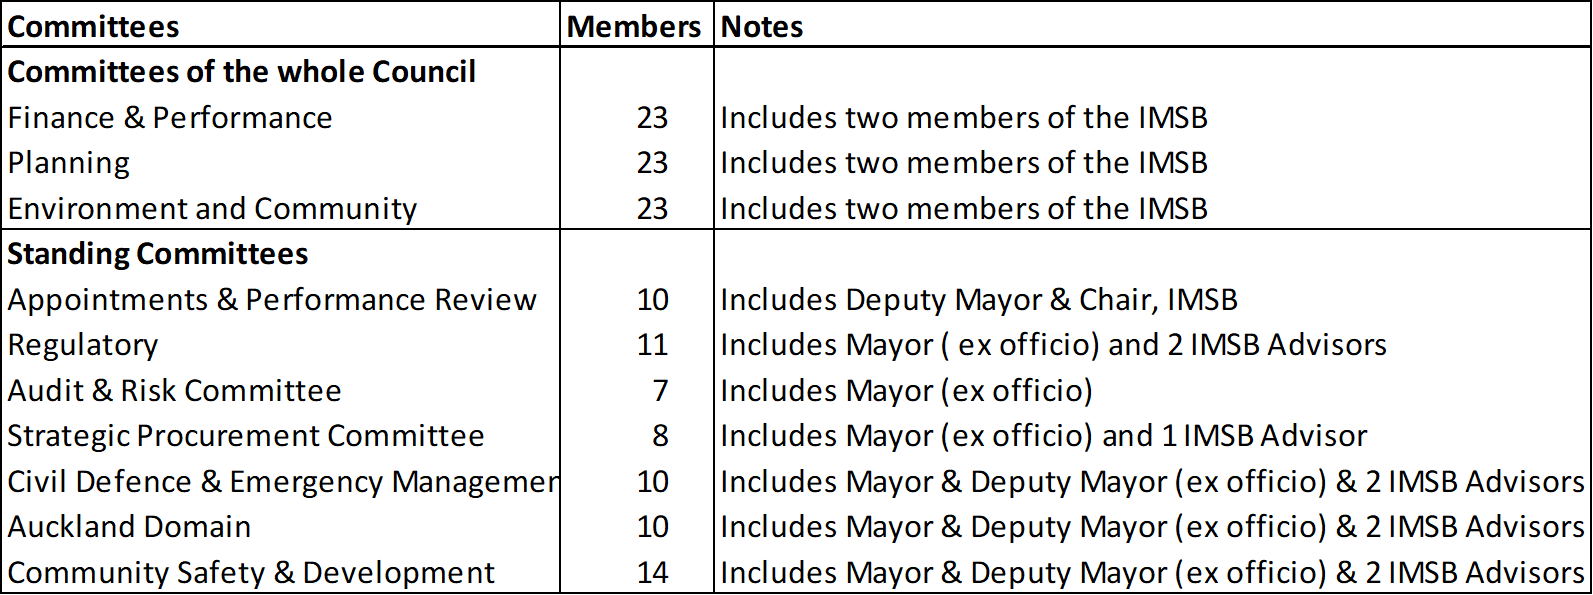
Given its size, Auckland Council has the potential to be compromised by unwieldy numbers and the cross-currents and mixed agendas that attend a crowded governance table. The committee structure is unlikely to offset this because, in a rather strange arangement, all councillors are members of the three main committees (Table 3).  Over-sizing committees reduces the advantages of having small groups specialise in key areas before deliberation on policy options by the full Council.
Table 3: Auckland Council Committees
     IMSB: Independent Māori Statutory Committee

Time to review Auckland’s governance arrangements?
The outline of governance here suggests that the Auckland Council has the potential for cumbersome decision-making despite any streamlining intended from consolidation of powers.
For example:
·        The Council operates in a top-heavy manner, if only because its key decision-making functions are subject to deliberation by committees of 22;
·        The relationships among the governors (councillors, CCO directors and board members) and managers are potentially complex and communications constrained across boundaries;
·        Representation within the council is based on low elector turnout, while representation across local boards is uneven.
Given the evidence of rapidly rising costs in Auckland Council’s first eight years, the picture of consolidated power at the centre without obvious democracy, decision-making, or performance benefits suggests that it is time to again review Auckland’s governance arrangements.


[1]            Note to reporters: it is important for clarity to use a singular verb when reporting on the Council. The Council are not to blame for getting it right or wrong: the Council is.
[2]           The Independent Māori  Statutory Board pays an important role in this respect in Auckland.
[3]            The Royal Commission on Auckland Governance (2009) claimed “over 40” CCOs associated with local councils in 2009 (Final report, p.13). This implies a trade-off through amalgamation between many small organisations operating locally and a few large ones operating regionally.

Monday, November 19, 2018

Consolidating a Council - Does Bigger Simply Mean ... Bigger?

Reviewing the Auckland experiment
This is the fourth post reviewing the progress of Auckland Council following the amalgamation in 2010 of seven territorial and one regional authority and the reorganisation of transport and water delivery agencies. The aims included greater regulatory consistency across the region, the capacity to make adequate, coordinated provision for growth, and cost savings.  

The story so far
The previous posts looked at trends in Auckland Council from 2012 to 2018: employment up 17%; employment costs up 24% (in real terms); operating expenditure up 26%; total revenue up 51%. The leap in revenue reflects spending on property, plant and equipment, up 32% in 2018 compared with 2012, or NZ$11bn over the period. All this, while population grew by around 15%. 

Despite the jump in costs and funding, we can’t label the Auckland Experiment a failure on the evidence so far.  So this post adds to the analysis by looking briefly at performance, albeit in general terms. It looks at broad efficiency trends by comparing Auckland with New Zealand’s other regions. These include unitary councils (regional and local functions combined) and multi-council regions.
But first a couple of scene-setters.  What is the role of councils? And how might efficiencies arise from amalgamation and operating at a larger scale? 
Skip these two boxes if you just want to look at the numbers.
Scene Setter 1 - What councils do (or should do)
There are good arguments for local councils to oversee the provision of local public goods where the market won’t deliver or where there are natural monopolies. It is also appropriate for them to levy rates over property to do so, and to charge directly for the services they provide.
Obviously council roles will change as shifts in technology or behaviour create competition where none existed before (and they consequently pull out of infrastructure or service delivery) or where the public appetite for amenities changes (for example from passive to active reserves).
It is important, though, that property rates relate to the infrastructure provided, and that charges for services relate to the fair cost of their production.  It is also important that councils produce infrastructure and services efficiently. Unduly high costs penalise residents and businesses, reducing a city’s competitiveness and attraction. 
Councils also have an obligation to continuously review and evaluate what infrastructure and amenities should be provided, where, and when. In this they are required to reflect on constituents’ needs and preferences, engaging with the community through survey, consultation, submissions, and, ultimately, the ballot box. This is necessary to legitimise new activities and allow cross-subsidies between services, areas, or generations. 
Discretionary council decisions should also: be legal, reasonable (both matters that may be contested in the courts), and should not unduly lower efficiency.

  
Scene Setter 2        Potential efficiencies from reorganisation
There are the three ways by which efficiency might be improved through local government consolidation and reform:
Administrative gains: from lowering administrative, compliance, transaction, and regulatory costs.  Processes may be streamlined, duplication eliminated, best practices implemented, and economies of scale gained (increasing what is achieved by more than what it costs).
Technical gains through improved financial capacity to invest in new systems, processes, and plant to lift output, enhance outcomes, reduce service failures, and lower costs.
Allocative gains from delivering the most appropriate mix of goods and services, and making effective use of capital to best deploy people and plant to achieve desired outcomes.  

Measuring gains
In this post, I consider the efficiencies in Auckland Council that should come from administrative and technical advances using changes in two measures: the number of local government employees and operating expenditure per head of population.


Auckland Council numbers are compared with numbers for all New Zealand regions from 2000 to 2018. Following the logic justifying amalgamation, the creation of Auckland’s large unitary council in 2010 should have increased the residents served relative to council employment numbers and lowered costs to residents more than in regions with smaller, multiple councils.  And within Auckland we would expect council costs to decline relative to population.
The indicators used assume that the council output is a function of population. This is a high order assumption, over-riding differences in the mix and quality of amenities and services and differences in the physical environment of regions.  Equally, employee numbers is also only an approximate measure of inputs.
While these assumptions keep analysis simple, they also limit the conclusions that can be drawn.
Employment up, productivity down?
We know employment growth has been modest within the enlarged Auckland Council, confined to Council Controlled Organisations. However, the costs of council employment have risen significantly, in part through staff movement into higher-paid bands. 
To consider the bigger picture, the number of residents in each of the 16 regions was divided by the number of people employed in local government administration and in water supply, sewage and drainage servcies (sourced from Business Demography, Statistics NZ). The higher the figure, the more productive a region is (fewer employees relative to residents).  The line should rise if productivity is improving.

The results for Auckland and the median for all regions have been plotted in Figure 1. Auckland stands out as more productive than most regions, but contrary to expectations, more so before the 2010 reforms than after.  Other strong performers are smaller regions with unitary councils (Gisborne, Nelson, and especially Tasman).
Figure 1: Residents per Council Employee, 2000-2018 
The downward slope indicates more employees relative to population, suggesting falling productivity. Of course, this may indicate changes in the scope of council activities, but it is hard to envisage a shift that would lead to a 26% fall in 8 years (as in Auckland) or even a 14% fall (as in the national median). And if costs rise faster than output, regional (and national) productivity suffers.

While Auckland ranks well against other regions on this measure (see the bar graph and right-hand scale), its steep downward slope and convergence on the median across regions is inconsistent with expectations of economic gains from consolidation (despite the recovery in 2017).

Expenditure: more for less?
Operating expenses (sourced from Statistics NZ) have been summed for councils in each region from 2000 to 2017, converted to 2018 dollars and divided through by regional populations.  In theory, expenditure per head should fall as councils become more efficient, and should be lower in larger councils, Auckland being the obvious example (see the Scene Setter 2, above).


Well, neither expectation appears to hold. Operating costs per employee have been increasing.  In Auckland there was some moderation after 2012 but it is difficult to distinguish its performance from the median for all councils in Figure 2. 

Figure 2 also includes high and low performers.  The best performing regions fall below the lower quartile and the worst above the higher quartile.  The single best performer recently has been the Hawke's Bay with its population concentrated in the twin cities of Napier and Hastings. The worst has been the West Coast with its sparse population spread over a physically challenging area. 
The key observation, though, is that efficiency as measured here has not improved in Auckland which continues to sit around the middle of the pack. 

Figure 2: Council Expenditure per Resident, 2000-2017
What can we conclude?

On the measures used here, local government costs are moving ahead of population growth in most regions. Auckland is no exception. At best, te city has maintained efficiency in line with other regions. Consolidation of Auckland's councils has not been enough to reverse a decline. 


As noted, these measures of efficiency assume a similar mix and level of services delivered by the consolidated council as delivered under similar conditions by councils in other regions, and as delivered by the previous Auckland councils. At the level this analysis, our most robust conclusion is that the measures used provide no evidence that consolidation has lifted Auckland's game. To date, the costs of consolidation have not yielded obvous benefits.
Exploring why means looking into allocative efficiency: is the additional funding Auckland Council is receiving being allocated to investments that lift productivity as they deliver better services? In the absence of evidence of better performance the consolidated council does not hyet yet appear to be on the path to savings. And if Auckland is going to deliver on the promise of 2010, can we afford the spending evidently required to get there?  

→ An aside on allocative efficiency
Sound allocation decisions are  necessary to deliver operating gains: spending the right amount on the right things and getting the right people to put them in place. In Auckland Council resource allocation is driven in large part by Council Controlled Organisations. The quality of resource allocation decisions needs unravelling at that level. 


However, it is timely to note that a recent internal report regarding decision-making for cycleway investment by Auckland Transport identifies that spending was justified by over-estimating demand.  This is on top of major under-estimates of the cost of the Central Rail Link which was justified on the basis of a $2.3bn budget in 2011 (and a series of assumptions that were hardly grounded in reality). That budget  had (predictably) blown out to $3.4bn by  2016, and continues to climb, with no clarity on where it will end up. 
These examples confirm how large organisations are prone to resource misallocation; the larger the project the more likely it is to blow out, and the bigger any over-run will be. The impact of failures in resource allocation decisions in a large council can be further-reaching than similar failures by smaller organisations, given the increased funds at their disposal. And placing a substantial share of the increased funds in CCOs at arm's length from the political process may be no remedy.  Poor spending decisions by councillors or their agents and advisors can lead to uneconomic investment: over- or under-capacity, in the wrong place, badly timed, or over-priced.  The end result? A drag on city efficiency and productivity.

 [1] There is a difference.  Efficiency refers to how well tasks are done, and specified outcomes       achieved.  Productivity requires that those outcomes are the correct ones.